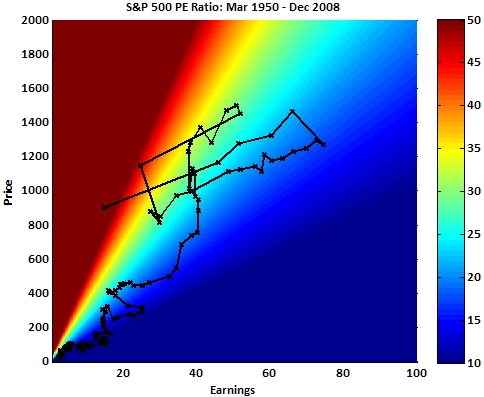
I just threw this chart together out of curiosity. The color represents the S&P 500 PE ratio

In principle, you may expect the scatter plot to stay within a “normal cone”. At the end of Q2 ’09, the PE ratio was 122 (i.e. WAY OVER TO THE LEFT).
What is the path of least resistant to get back to “normal”?
- Down and to the right?
- Flat and to the right?
- Up and to the right?
I think the most likely path is gradually up and to the right (which is what inflation would do). What do you think?
Technical note: I capped the colors between a PE ratio range of 10-50 to emphasize the gradation.
Disclosure: I’m long BGU, EDC, ERX, and TMV.
Interesting chart, where did you get the data from to chart this? Could you do one for the Nikkei Index from, say, 1980 onwards?
I think the path of least resistance will neither be down, nor up, but flat and to the right.
I don’t see inflation as much of a problem when we still have a lot of consumer and commercial debt to deal with.
Hi Jeremy,
Thanks for the comment. My opinion about inflation is less about internal US economic factors and more about global market forces. If the dollar continues its slide, or worse, accelerates, inflation is inevitable regardless of anything else. Notice how the markets these days are closely following the dollar? Every asset is moving with the dollar. Everything is correlated. The dollar has become a carry trade. Oil prices are hovering around $80 and will likely continue upwards (aside from possible daily fluctuations). The treasury auction was not particularly strong today either. All we need is for China to lose its appetite for US debt and or revalue its currency and the USD will take another leap downward. Etc Etc.
In real terms, I agree with you. The most likely path is flat and to the right (maybe even down a bit), but I still think the nominal path is slightly up and to the right.
I’ll see if I can dig up some Nikkei data and post a follow up.
Cheers and thanks again for the comment!